IEC 62056 Electricity Meter Simulator

A TCP-based IEC 62056-21 compliant electricity meter simulator for developers, test engineers, and embedded system designers. Test your integrations without the need for real hardware.

  • Short/default readout (OBIS 1.8.0, 1.7.0, 32.7.0, date/time)
  • 15-minute interval load profile (P.01) simulation
  • IEC 62056-like message flow over TCP
Electricity Meter Simulator
Electricity meter illustration
Serial No 12345678
Total Energy 0012345.67 kWh
Instant Power 0001.42 kW
Voltage 230.4 V

What Does This Project Do?

It simulates an electricity meter in a fully software-based manner, using a message flow similar to the IEC 62056-21 protocol. It does not perform real measurements; instead, it generates a positive, consistent energy consumption profile that increases over time.

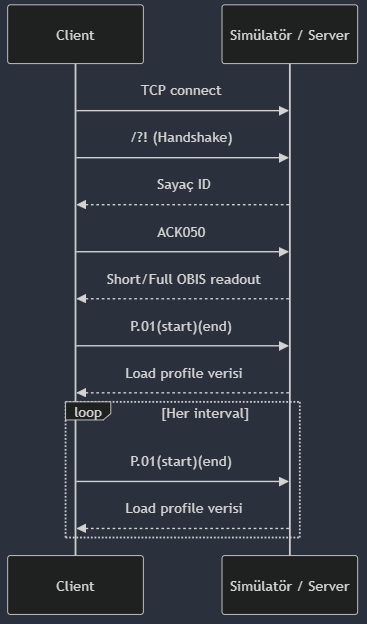
Short / Default Readout

Just like typical meters, after the /?! handshake and ACK050, it produces a short readout containing the serial number, total consumption, instant power, voltage, and date/time information.

Load Profile

It records consumption values at 15-minute intervals (or accelerated periods for testing). These values are both written to a file (P.01(YYMMDDhhmm)(vvvv.vv)) and queryable over the protocol.

Developer-Friendly Architecture

The TCP server, protocol layer, and meter core are decoupled from each other. This makes it easy to add a UI, integrate real hardware, or implement additional OBIS commands.

Architecture Overview

The project simulates a real meter's behavior by breaking it down into modular layers. The visual below provides a high-level summary of the data flow from the TCP client, through the meter core, to the load profile file.

Diagram showing the IEC 62056 MeterSim architecture: data flow between TCP client, TCP server, protocol layer, meter core, and load profile file

Protocol Flow

The simulator uses TCP instead of a serial port; however, the message flow is the same as a classic IEC 62056-21 meter.

1. Handshake

Client → Meter  : /?!<CR><LF>
Meter  → Client : /ISK5ME382-1003<CR><LF>

2. ACK & Short Readout

Client → Meter  : ACK050<CR><LF>
Meter  → Client : 
 0.0.0(12345678)
 1.8.0(0012345.67*kWh)
 2.8.0(0000123.45*kWh)
 1.7.0(0001.42*kW)
 32.7.0(230.4*V)
 0.9.1(14:22:31)
 0.9.2(24-01-01)
 !

3. Load Profile (P.01)

Client → Meter: 
  P.01(YYMMDDhhmm)(YYMMDDhhmm)
  e.g.: P.01(2401010000)(2401020000)
Meter  → Client :
  P.01(2401010000)(0000.42)
  P.01(2401010015)(0000.38)
 ...
 !

Quick Start

1. Run the Simulator

python run_simulator.py --host 127.0.0.1 --port 5000 \
  --interval-seconds 10

The example above reduces the 15-minute interval to 10 seconds for testing. To use the actual 15-minute interval, you can pass the --interval-seconds 900 parameter.


python run_simulator.py --host 127.0.0.1 --port 5000 --meter-id ZD5ME666-667

Example with a custom port and meter ID.

2. Connect with a TCP Client

telnet 127.0.0.1 5000
/?!<Enter>
ACK050<Enter>
P.01(2401010000)(2401012359)<Enter>

If you wish, you can also send the same messages from your own STM32 / UART bridge to run integration tests.

TCP Client Test Application

Meter_Client_Test.py is a simple test client that connects to the simulator at given intervals and queries both the identification/short readout and the load profile (P.01) for a date range you choose.

1. What Does the Client Do?

This script imitates the calls a real application or embedded device would make:

  • Opens a TCP connection to the specified IP/port.
  • Sends /?! and reads the meter ID.
  • Sends ACK050 and receives the short/full OBIS readout response.
  • Fetches load profile data with the P.01(start)(end) command.
  • Repeats this operation at your specified second interval (continuous monitoring).

2. How to Run It

python Meter_Client_Test.py --host 127.0.0.1 --port 5000 \
  --interval 10 --start 2603171000 --end 2603171050

Arguments:

  • --host: IP address of the meter simulator (default 127.0.0.1).
  • --port: TCP port (default 5000).
  • --interval: Wait time between queries in seconds (default 10).
  • --start: Load profile start time in YYMMDDhhmm format (default 2603171000).
  • --end: End time (YYMMDDhhmm). If left empty, the script uses the current time at runtime.

3. Communication Flow (Sequence Diagram)

Request flow between the client and the simulator: TCP connect, handshake, OBIS readout, load profile query, and loop

4. Sample Output

Starting TCP client...
Target: 127.0.0.1:5000
Interval: 10 sec
Load profile range: 2603171000 - 2603171050

--- New Query ---
ID Response:
/ISK5ME382-1003

ACK Response:
0.0.0(12345678)
1.8.0(0000025.73*kWh)
1.7.0(0001.42*kW)
32.7.0(230.4*V)
0.9.1(10:50:00)
0.9.2(26-03-17)
!

Load Profile Response:
P.01(2603171048)(0000.51)
P.01(2603171049)(0000.45)
P.01(2603171050)(0000.54)
!...

5. Load Profile Files

The simulator stores the load profile it produces and the total index on disk in two files. These files act as the meter's memory and ensure that the consumption total is preserved even if the application restarts.

meter_data.txt (Load Profile Records)

Each line represents the consumption for one interval:

P.01(2603171048)(0000.51)
P.01(2603171049)(0000.45)
P.01(2603171050)(0000.54)
...

Format: P.01(YYMMDDhhmm)(vvvv.vv) → the energy consumed (kWh) during the given time slice.

meter_data_total_endex.txt (Total Index)

Contains the last timestamp and total consumption information:

last_timestamp(2603171050)
total_import(25.73)

When the application starts, this file is read and the 1.8.0 OBIS value (total energy) is set according to this index. This way the meter resumes from where it left off, just like a real device.

Source Code and Download

You can review the project directly on GitHub or download the packaged version of the Python application to try it out quickly.

Daily Consumption Visualization

Using the load profile generated by the simulator, you can visualize daily consumption as a simple yet elegant bar chart.

Sample Daily Load Profile Total ≈ 12.34 kWh (1.8.0 ≈ 12.34 kWh)
00:00
0000.42
00:15
0000.38
00:30
0000.35
...
...
23:45
0000.41